
There are 7.8 million researchers(1) in the world, and it is safe to say that they all use survey as a method of data collection at least once in their career. This already amounts to an overwhelming number of surveys, but it carries even far more weight when you think of all the data collected through these surveys and all the fields they cover. And yet, many surveys, whether used for data collection, feedback, or general opinions, are not well validated or validated at all.
That is why we have outlined a number of steps to determine whether your survey is actually measuring what you want it to measure. We used this method in our EICAA project (Entrepreneurial and Intrapreneurial Competence Assessment Alliance)(2). EICAA is building a testing tool to measure and assess entrepreneurial competencies. We did 2 rounds of validation for this tool, using a 5-step process.
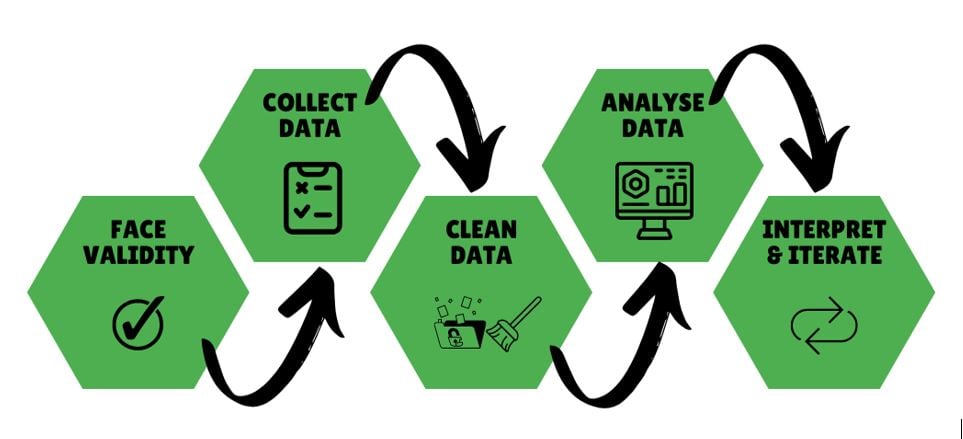
- Establish face validity
The survey was formulated using a well-researched rubric system. It was then scanned, and subsequently iterated, several times by more than 15 experts of the project consortium.
Point to note: the likelihood of version control issues increases with the number of versions. You can prevent this by putting an effective version control strategy in place.
- Run a pre-test (or two)
To validate the (different versions of the) survey, we ran 2 pre-tests with over 300 responses across both rounds. Currently, the EICAA consortium is running a pilot round, aiming at 1,000+ responses.
Point to note: planning for data is crucial. For some of our analyses, we will need at least 200 points of data, so wear your planning hat well in advance!
- Clean collected data
Our survey was an online survey on Qualtrics, which is why data entry wasn’t an issue for us. If you plan to have an offline survey, involving more than just one person is always a good idea for data entry.
To clean our data, we did the following:
- Elimination of duplicate entries.
- Recoding values. For questions such as demographics, which had textual answer options, we recoded the value to numbers for simpler analysis.
- Removing irrelevant data. This is analysis-specific. For example, if you want data from only a specific data range, the data outside it are irrelevant.
- Treating missing values. We removed those with numerous missing values and used mean imputation on the others.
- Bad data. We removed data points where all questions had the same answer on our 5-point scale, and all responses extending the usual response time limits.
Point to note: we didn’t have the problem of reverse coding. But if your survey has questions with answer options opposite to the other questions, you need to reverse code the data.
- Statistical analysis
Aiming to be on the right side of the bell curve, we performed the following analyses on the data collected in our pre-test rounds:
- Reliability analysis. We measured reliability through 3 different parameters: Cronbach’s Alpha, Split Half, and Omega using SPSS. A reliability score between 0.6-0.7 is considered to be acceptable. Above 0.8 is good or very good. Scores above 0.95 might be an indication of redundancy rather than excellent reliability.
Point to note: take into account the data type when choosing a reliability parameter. For example, parametric or non-parametric, nominal or not, etc.
- Normality analysis. In addition, we wanted to check whether the assumption of normality is true for each of the competences that we have. For this, we used both Shapiro-Wilk and Kolmogorov-Smirnov test on SPSS.
Point to note: this was a nice-to-have rather than a must-have for our analysis.
- Exploratory factor analysis. In the first round of pre-testing we did an exploratory factor analysis to determine the structure / grouping the data suggest. We defined 3 main area domains, with 6 competencies each, resulting in 79 survey items. We received about 73 responses.
Point to note: an exploratory factor analysis is not recommended when there are more survey items / variables than points of observation / responses. We addressed this by breaking our responses down into groups and then conduct the analysis. We divided our data into the 3 main area domains.
- Structural equation modelling. This is a multivariate statistical analysis technique to analyze structural relationships, combining factor analysis and multiple regression analysis. For this, we used SPSS AMOS. Through this technique, we confirmed our hypotheses about the causal relationships between competencies and how our model could improve with changes suggested by the data.
Point to note: as mentioned before, you need at least 200 responses for the results to be accurate.
All in all, the little seed we planted at the beginning of our work has grown into pre-test stage and is now speaking for itself, and all it took were these 5 simple steps.
References
- https://www.universityworldnews.com/post.php?story=20151114025241252#:~:text=The%20number%20of%20researchers%20has,the%20United%20States%20and%20Japan
- https://www.eicaa.eu/

